A COMPARATIVE SURVEY BETWEEN THE LEVELS OF PERSONAL AND PERCEIVED STIGMA AMONG PROFESSIONALS WORKING IN THE PSYCHIATRIC CARE SYSTEM
Abstract
Background: In Romania there are very few national studies of the stigma associated with depression1. The psychiatric health care system is mainly concentrated on psychiatric hospitals with few ambulatory services offering very limited services, approximately 80% of the psychiatric staff is working in the psychiatric hospital. Coming from a 45-year period during which the psychiatry was only biological the Romanian population has started to discover and use the psychotherapeutic services provided by psychologists, a profession that was forbidden for a 20- year period during the communist time. This study seeks to compare the nature and extent of stigma among the professionals working in the psychiatric care system namely psychiatric hospital. Methods: A survey was conducted in professionals' group using the depression stigma questionnaire. The study comprised of a survey of 139 persons aged over 18 years, psychiatric staff working in the psychiatric hospital: psychiatrists, psychologists, nurses, carers and other professions (represented by social workers). The respondents reported their personal attitudes (personal stigma) and perceptions of the attitudes of others (perceived stigma) in the community they work. Results: Personal stigma is lowest among the highest trained professionals (psychiatrists and psychologists) and highest among the lowest specialized personnel (carers and other professions). Perceived stigma is greater than personal stigma among all the professionals working in the psychiatric care system, the highest trained professionals have highest levels of perceived stigma and the lowest trained professionals have the lowest levels of perceived stigma. Conclusion: Stigmatizing attitudes are common to all professionals, the results suggest that there is a need to train better the staff according to its needs and to make more public awareness interventions tailored to the targeted groups. The current results provide a baseline for future interventions in order to decrease the stigma levels of professionals.
Background
Stigma attached to mental disorders is considered by health authorities, professionals and users of mental health services2 3 4 5 as one of the most important barriers to overcome in the community, constituting one of the four main directions of action of the Global Mental Health Action Plan6. Stigma is a key component taken into consideration by a person that needs to seek professional help and very often it hinders the process of reintegration of the person in the community7 8 9and is a source of psychological distress10. Despite of its importance we have few studies that try to understand stigma phenomenon and the society groups in which this phenomenon is wide spread and constitutes a real barrier for those who need support. An approach for understanding stigma and how the stigmatizing behavior forms among different society groups is to conduct comparative studies11 across these groups, especially among those whose members have a role and are important for facilitating access to care to those who need it. In this study we compare attitudes to depression of professionals from the psychiatric staff working in the psychiatric hospital. It is frequently assumed the fact the stigma appears less in the groups that have more information about depression and interact more frequently with people that are affected by depression. The limitations of this study refer to small selected sample that is concentrated in two psychiatric hospitals. This paper is concerned with stigma and in particular, we test the hypotheses that stigma is less prevalent in highest trained psychiatric staff than the lowest trained staff, that the pattern of the stigma will differ in the three groups, that personal stigma will be less pronounced compared to perceived stigma in all three groups.
Methods
Survey questionnaire
Personal and perceived stigma
Stigma was measured using two 9-item scales12 [13]. The first scale assessed the respondent’s personal attitudes towards the person with a depression diagnostic (Personal stigma). The second scale assessed the respondent’s beliefs about other people’s attitudes towards the person with a depression diagnostic (Perceived stigma). Both scales contained essentially the same statements, but differed in terms of whether they were aimed at personal attitudes or the perceived attitudes of others (12). An example of a statement from the Personal stigma scale was: ‘Depression is not a real medical illness’. The corresponding statement in the Perceived stigma scale is ‘Most people believe that depression is not a real medical illness’. (12) Ratings for each item of each test were made on a 5-point Likert scale (0 = strongly agree, 1 = agree, 2 = neither agree nor disagree, 3 = disagree, 4 = strongly disagree).
The survey
A survey of 139 adults aged 18 years or over was conducted over the period September to October 2016. The target interviewees were persons working as psychiatric care staff: psychiatrists, psychologists, psychiatric nurses and carers as well as social workers from psychiatric hospital. The survey questionnaire was translated into Romanian and in order to verify the accuracy of the Romanian translation of the survey, questions were retranslated into English by an accredited translator who had not sighted the original version. As we have not used a case vignette for depression in the questionnaire we used in the translated questionnaire the syntagma ”diagnostic of depression” and not simply depression.
Statistical analysis
For data analysis it was used the Microsoft Excel Program (Microsoft Corp., Redmond, WA, USA), together with XLSTAT for MS Excel (Addinsoft SARL, Paris, Franţa) şi programul IBM SPSS Statistics 20.0 (IBM Corporation, Armonk, NY, USA).
The information obtained were stored in Microsoft Excel files and these were statistically processed in order to analyse the relationships between the demografic data and self and perceived stigma within each group as well as among the three studied groups.
The complex statistical tests such as Z test for proportions, Square Chi test for independence, Kappa test of Cohen and B test of Kendall were performed using the commends from the XLSTAT module and/or with the SPSS program. In the present study for the analysis of the incidence tables we used the square Chi test in order to identify the distribution differences according to the important variables, as well as the Cohen’s Kappa test and Kendall’s tau B test for demonstrating the correspondences between the personal opinion of the respondents and what they think what is the opinion of the majority of people.
Fot the square Chi test for testing the dependence there were calculated the results of the test for the dates from the incidence tables, these results being compared with the threshold value that indicates a significant dependence (95% or 99%) or a highly significant dependence (99.9%) between the two classification factors.
We used the following interpretation of the p values, directly delivered by the program used for the statistical analysis :
· p < 0.05, significant rezult (S, 95% confidence that there is an asssociation between factors);
· p < 0.01, significant rezult (S, 99% confidence that there is an asssociation between factors);
· p < 0.001, highly significant result (HS, 99,9% confidence that there is an asssociation between factors); · p > 0.05, insignificant result (NS, confidence that there is an asssociation between studied factors is lower than 95%, so the error to reject the hypothesis that the factors are independent is higher than 5%, threshold considered to high).
Results
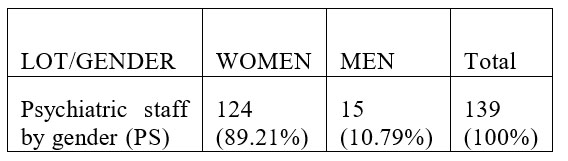
Taking into consideration the fact that at the country level the proportion of males is 48, 6% and 51,4% females we notice that there is a slight semnificative difference between these proportions and those calculated for the number of subjects from the study group, p value calculated with Z test for proportions being <0,0001. In conclusion, in the three study groups analysed the female weight is semnificantly higher then the female weight in the general population. This is well known especially within the health sector, in many countries women comprise over 75% of the workforce
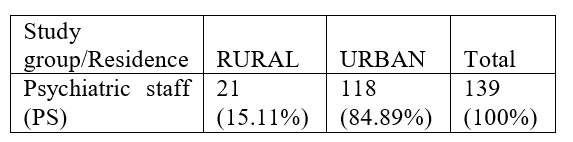
Taking into account that the population at country level lives 46% in rural area and 54% in urban area we can notice that there is a highly significant difference between these proportions and those calculated for the respondents included in this group, the p value calculated through Z test for proportions being <0,0001. In conclusion, the percentage of the respondents from the urban area is much higher and this is explicable as most of the psychiatric hospitals are located in the urban area..
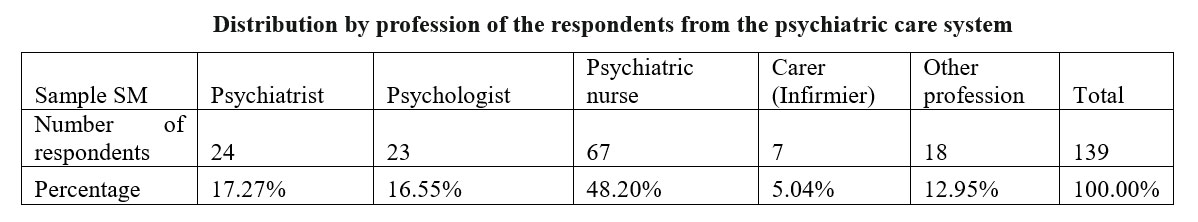
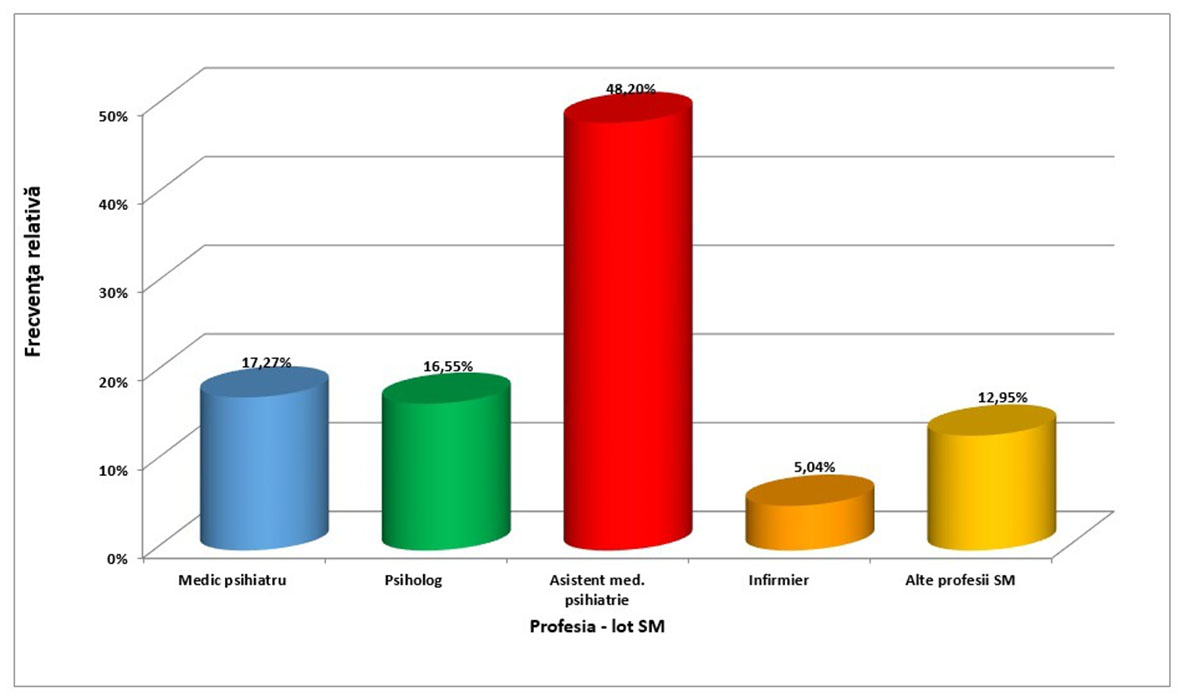
The distribution by profession of the respondents reflects the situation of the actual composition of specialists in the psychiatric care system with a smaller number of psychologists and psychiatrists and higher number of nurses.
For the purpose of this survey the professionals’ group was split in three subgroups:
·Subgroup 1 consisting of psychiatrists and psychologists
·Subgroup 2 consisting of nurses
·Subgroup 3 consisting of carers (infirmiere) and other professions (social workers)
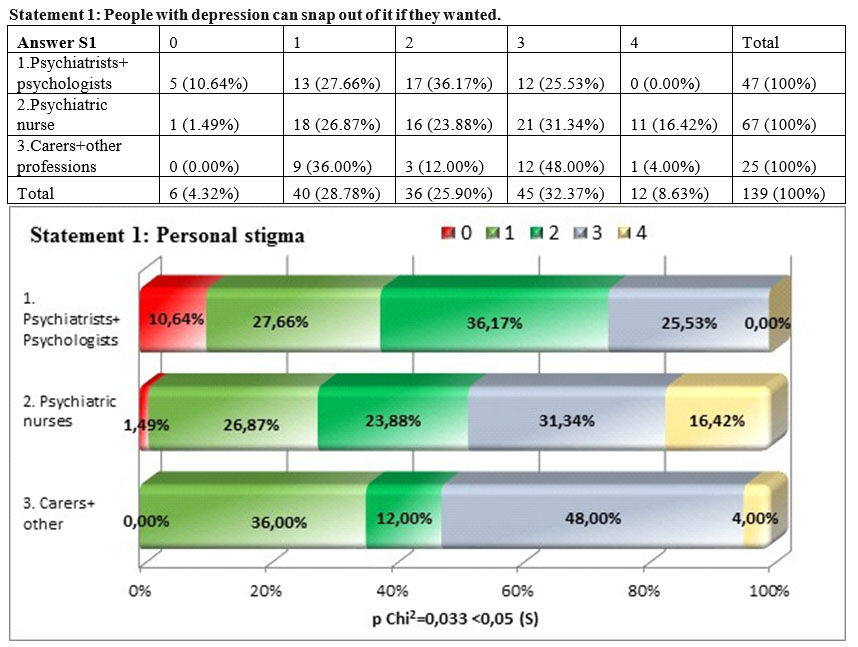
We found that there is a significant difference between the three subgroups in which we spilt the sample group of the professionals working in the psychiatric care system (square Chi p =0,033<0,05), the group formed by psychiatrists and psychologists being the one that considered in the lowest measure (38,3%) that those who suffer from depression can snap out of depression if they want to. This shows that the high level training specialists from the system of care consider depression as being a real illness that can be treated, at the other end being the nurses, carers and other professions that do consider that depression is a state that can be overcome using only the personal will. We also notice that there is high percentage of psychiatrists and psychologists (36,17%) that do not have a position with regards to this statement..
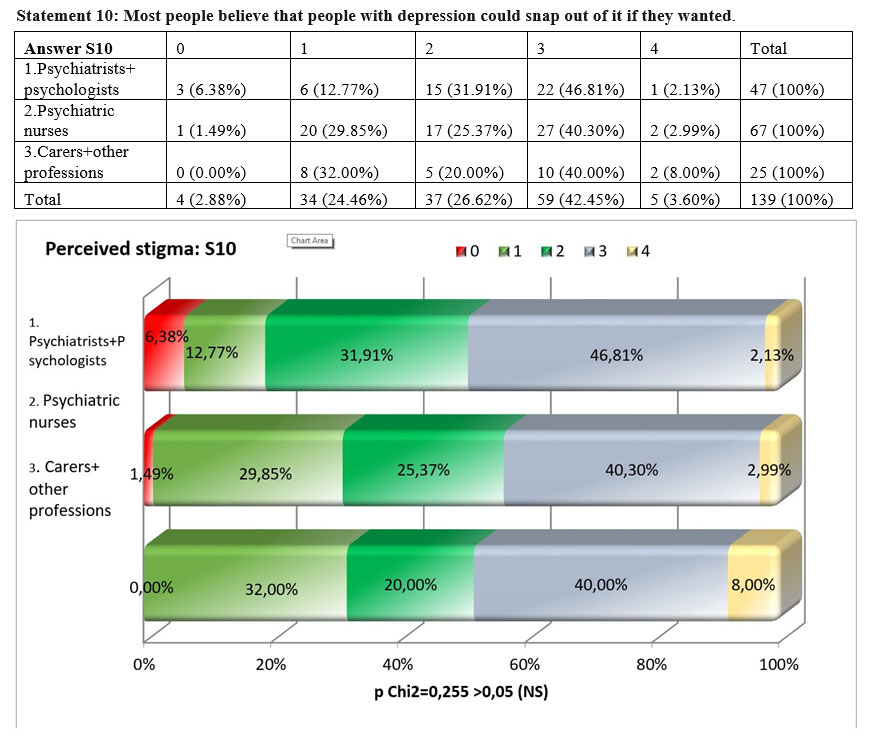
Comparing the answers of the three subgroups for the statement „Most people believe that people with depression could snap out of it if they wanted”, we noticed that there are no significant differences among the three subgroups, the result of the square Chi test being over the maximum threshold admitted, p=0,255>0,05. Analysing the concordance between the personal opinion of the respondents and what they think that the opinion of the majority of other people is, we found that for the whole sample we have a weak concordance, the value of Kendall’s tau-b coeficient being 0,365. The perceived stigma is higher in all the subgroups than personal stigma.
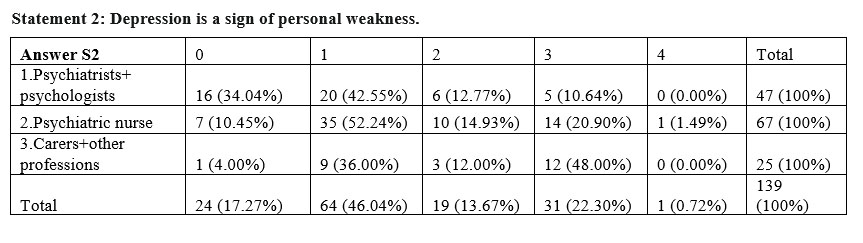
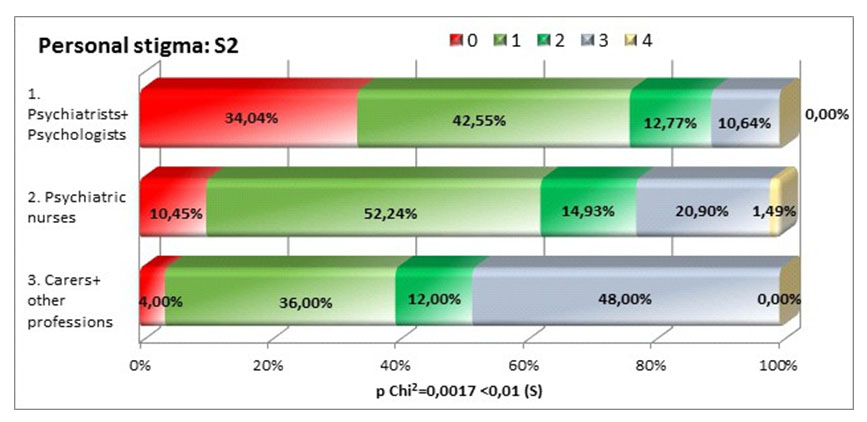
The three subgroups have completly different views with regards to the statement that depression is a sign of personal weakness (square Chi p=0,0017<0,01), psychiatrists and psychologists not agreeing with this statement in proportion of 76,59%, compared to 40% carers and other professions. This might show that people who do not have specialized training in the area tend to stigmatize more overlapping depression symptoms with character traits.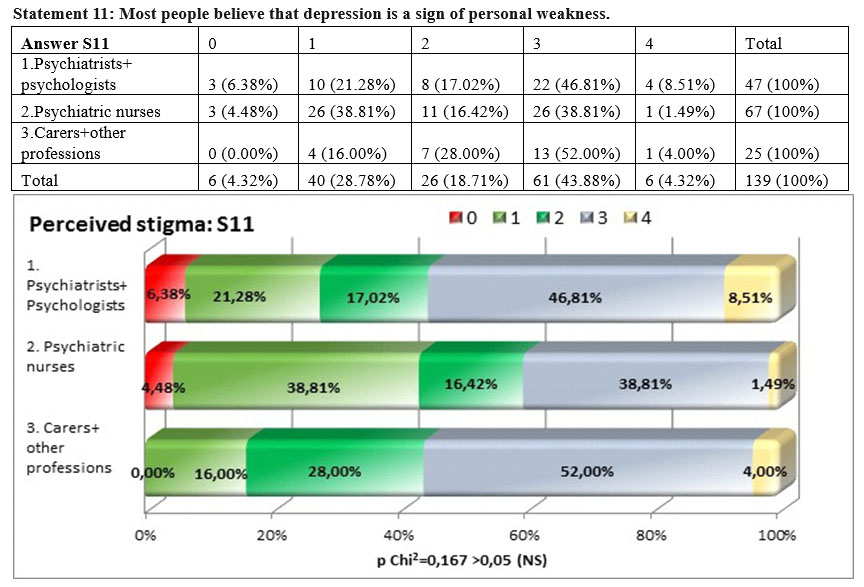
The perceived stigma is higher among the psychologists and psychiatrists but the differences among the three groups of professionals are not statistically significant, the result of the square Chi test is p=0,167>0,05. This means that the perceived stigma among psychiatrists and psychologists is very high (55,32%), interestingly is almost the same among carers and other professsions (56%) and lower among nurses (40,30%).
Analying the concordance between the personal stigma and the perceived stigma, we notice that there is a weak concordance, the tau-b coefficent being 0,337, the perceived stigma being higher than the personal stigma in all three groups, the biggest difference being showed by psychiatrists and psychologists.
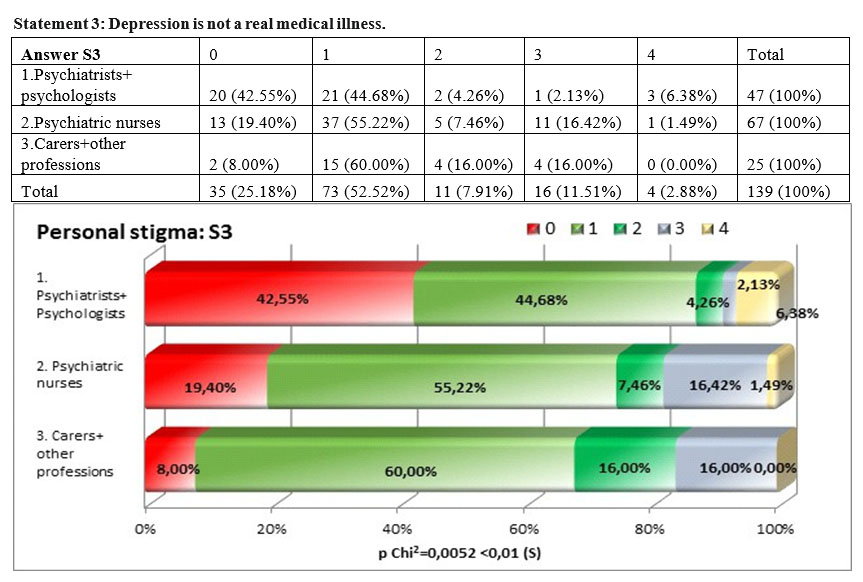
There are significant differences with regards to the statement „depression is not a real medical illness” (square Chi p=0,0052<0,01), 87,23% of psychiatrists and psychologists not agreeing with the statement compared to 74,62% of nurses and 68% of carers and other professions. There is little personal stigma shown at this statement by all three groups, the groups of psychiatrists and psychologists exposing the lowest stigma and this situation could be explained by the superior training and information they have in the area. We have also to notice that also the other two subgroups have very low stigmatization leveles, this is due also to the fact that they work in a system where depression is treated as a medical illness.
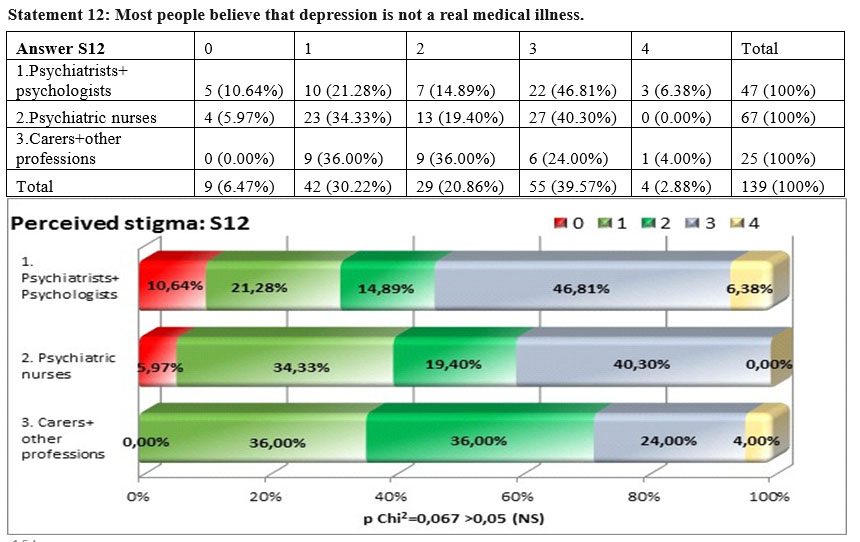
The answers for the perceived stigma in this case do not present a significant difference among the three subgroups but the result of the square Chi test p=0,067>0,05, was nearer to the threshold compared to the other statements, showing that there are bigger differences. The perceived stigma appear especially among psychiatrists and psychologists 53,19% and much lower in the other two groups 40, 30% and 28%.
Analysing the concordance between the personal opinion and what the respondents believe that is the opinion of the majority, we found no concordance (tau-b Kendall 0.068). This means that the difference between personal stigma and perceived stigma for this statement is very high.
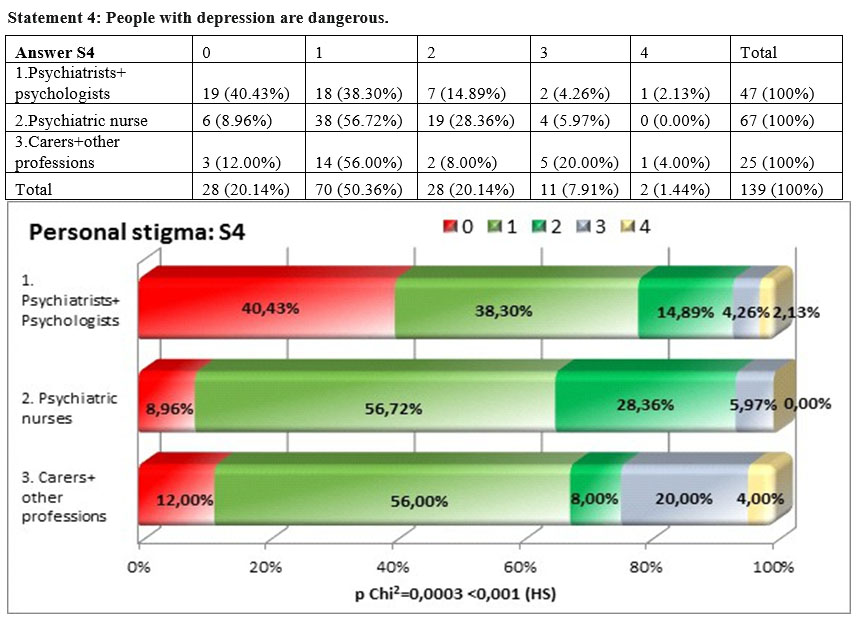
For the statement „People with depression are dangerous” there were bigger differences than to the previous statements among the three subgroups, the result of the square Chi test being statistically highly significant p=0,0003<0,001. At this statement the groups of psychiatrists and psychologists showed the highest level of disagreement (78,73%). It can be interpreted that depression. As an illness is not associated with an aggressive behavior.
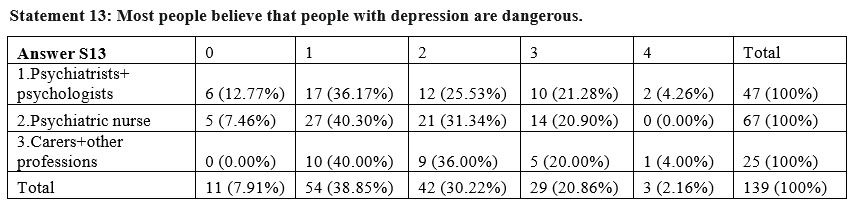
The answers towards the perceived opinion of the general public regarding the statement „Most people believe that people with depression are dangerous” do not present significant differences among the three subgroups, the result of the square Chi test being p=0,538>0,05. The perceived stigma is higher among all the three groups especially for psychiatrists, psychologists and nurses but stays almost the same for carers and other professions.
For this statement the agreement between the personal stigma and perceived stigma is minimal (tau-b Kendall= 0,274).
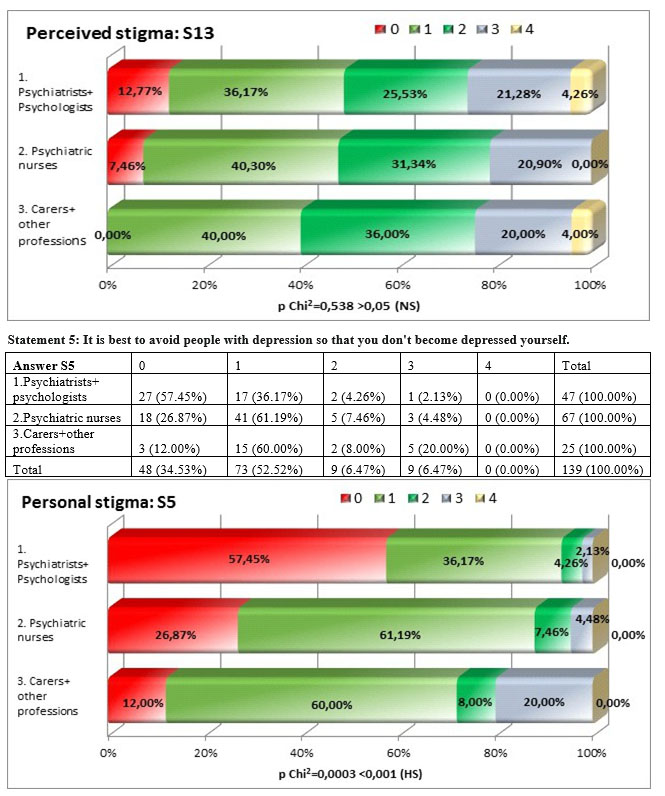
For the statement „It is best to avoid people with depression so that you don’t become depressed yourself” we identified a highly significant difference square Chi test p=0,0003<0,001, psychiatrists showing disagreement with the statement in a percentage of 93,56% compared to 88,06% of the nurses and 72% of carers and other professions. This might mean that people working in the system of care know that depression is not a communicable disease and that these people need support.
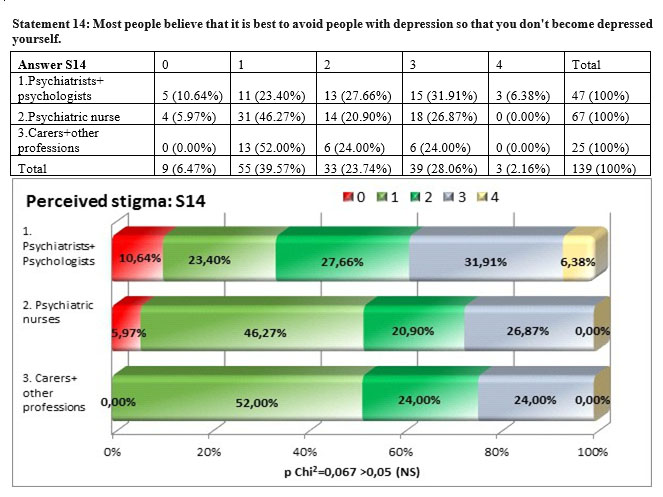
The answers to the perceived stigma with regards to the opinion of the general public regarding the „contagious” aspect of depression do not show a significant difference among the three subgroups but the result of the square Chi test, p=0,067>0,05, was nearer to the significance threshold compared to the other statements. For this statement there is no concordance between the personal stigma and the perceived stigma (tau-b Kendall= 0,067). The perceived stigma is higher than personal stigma in all three subgroups the highes level being shown by psychiatrists and psychologists 38,30% followed by nurses (26,87%) and carers and other professions (24%).
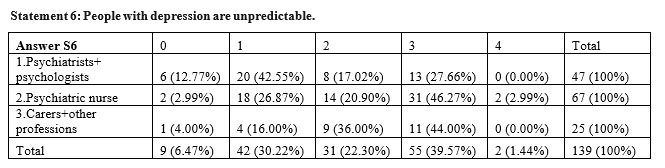
A low percentage of 27,66% of psychiatrists and psychologists agreed with the statement „people with depression are unpredictable” compared to 49.26% of nurses that exposed the highest personal stigma and 44% of carers and other professions, differences that are statistically significant, the result of the square Chi test being p=0,041>0,05.
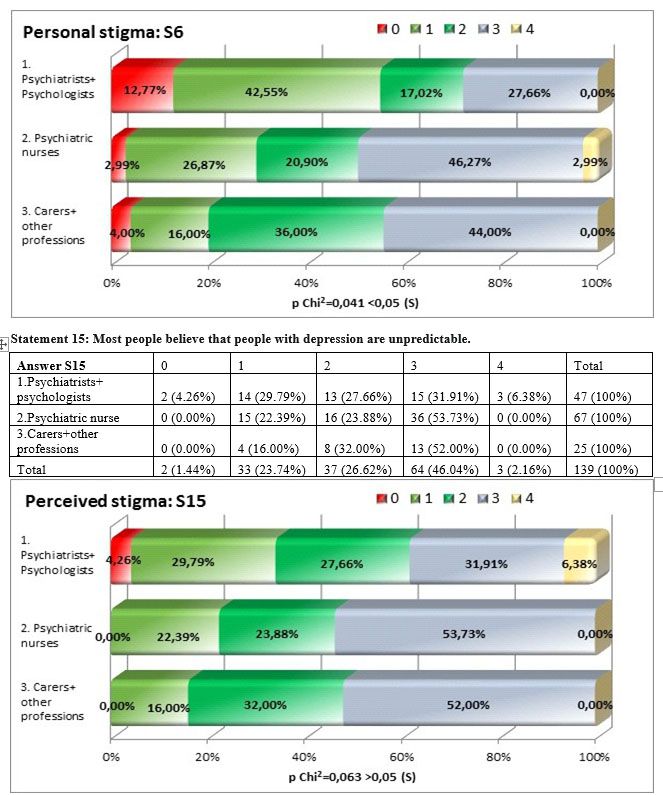
The perceived stigma linked to the impredictibility of the people diagnosed with depression shows differences among subgroups, even if higher than in other statements, the result of the square Chi test is very near to the maximum threshold of significance but going over it – p=0,063>0,05. The perceived stigma is remains highest among the nurses (53,73%) compared to the other subgroups, very near to carers and other professions and to a high difference from psychiatrists and psychologists (38,37%).
The degree of agreement between the personal and perceived stigma was statistically significant but weak to moderate, the value of Kendall’s coefficient tau-b being 0,333.
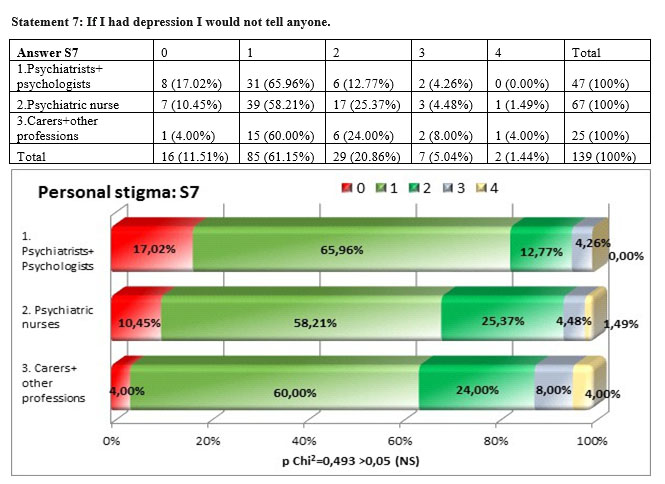
At this statement regarding the fact that at a personal level the respondents would hide if they had depression the carers and other professions are the ones that would have the most stigmatizing personal attitude compared to other subgroups (12%) compared to nurses (5,97%) and psychiatrists and psychologists (4,27%). Nevertheless the percentages are very low in all three subgroups showing the fact that they recognise depression as an illness that should be treated.
Even if there are differences among the three subgroups, those are not statistically significant the square Chi test being p =0,493>0,05.
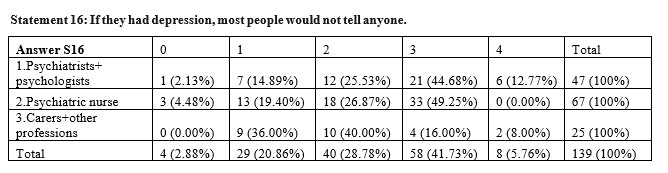
There are significant differences (p=0,012<0,05) between the answer given by the respondents from the three goups to the ststement „If they had depression, most people would not tell anyone” the psychiatrists and psychologists agreeing with this statement in a high percentage (57,45%), nurses disagree in procentage of de 49,25%, and carers and other professions disagree only in a percentege of 24%. There is no agreement between persoanal opinion and perceived opinion regarding this statement the tau-b coefficient being 0,044. The perceived stigma is much higher than the personal stigma regarding this statement.
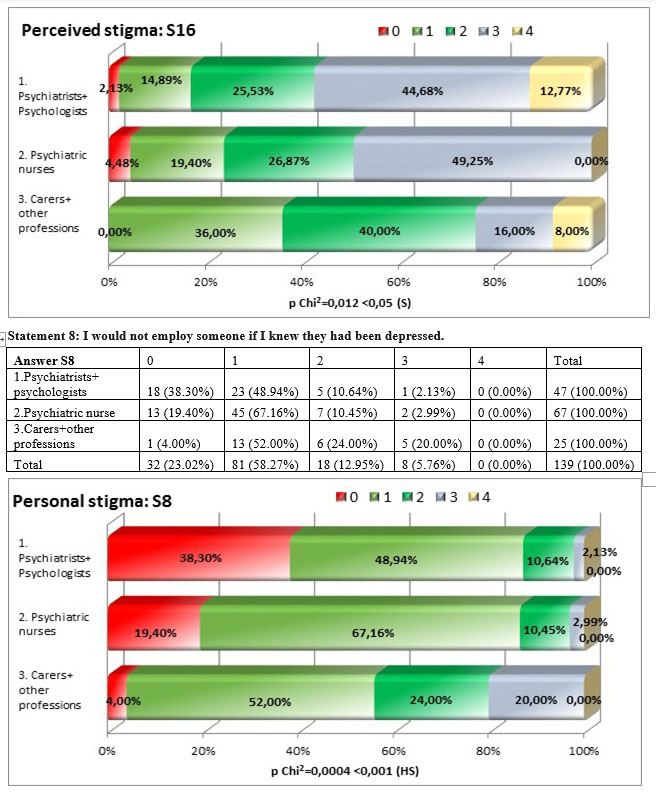
We i d e n t i f i e d h i g h l y s i g n i f i c a n t d i f f e r e n c e s (p=0,0004<0,001) among the three subgroups regarding their personal opinion linke to the employment of the people with depression, the least stigmatizing being psychiatrists and psychologists (87,24%), followed at a little distance by nurses (76,56%) and the highest personal stigma we find in the carers and other professions subgroup (56%).
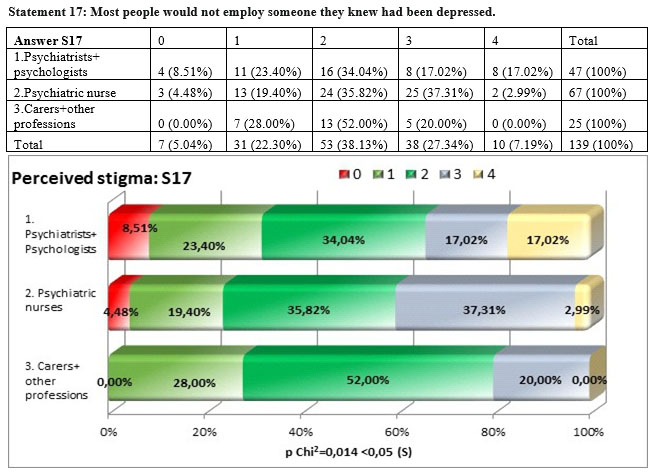
There were big differences in aswering to the statetment „Most people would not employ someone they knew had been depressed” square Chi test being p=0,014<0,05, especially among the distribution of answers for the carers and other professions group and the other two subgroups. The highest perceived stigma we found in the nurses subgroup (40,30%) followed closely by psychiatrists and psychologists subgroup (34,04%). There is a significant but weak concordance between the personal stigma and the perceived stigma tau-b Kendall= 0,252 nad the personal stigma is lower than the perceived stigma in all three subgroups.
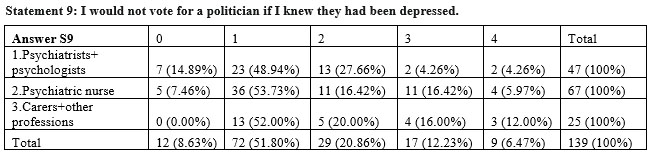
At the statement „I would not vote for a politician if I knew they had been depressed” there are no significant differences among the three subgroups square Chi test p=0,176 >0,05, the subgroup of carers and other professions scoring the highest at the personal level stigma (28%) followed by nurses (22, 13%) and psychiatrists and psychologists (8,52%).
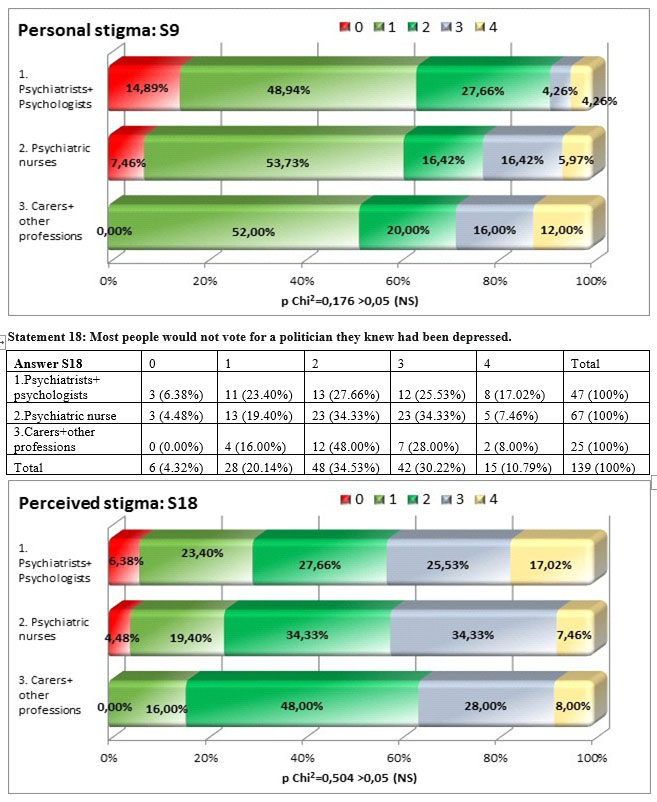
Among the answers of the three subgroups for the statement „Most people would not vote for a politician if they knew they had been depressed” there are notstatistically significant differences p=0,504>0,05, the distribution of anwers being more close than to the previous statements.
There is a significant concordance but weak to moderate between the personal stigma and the perceived stigma (tau-b Kendall= 0,386). Similar to the other 8 questions the perceived stigma is higher than the personal stigma in all three subgroups.
Results
Personal stigma
The results of the comparison between levels of stigma among the professionals working in the psychiatric care system are presented in Table 1. In general, personal stigmatizing attitudes were less common among the subgroup of the psychiatrists and psychologists than among nurses and carers and other professions. Compared to carers and other professions nurses more frequently indicated that the person with depression: does not have a real medical illness and it is unpredictable, for the rest of statements the carers and other professions have the highest levels of personal stigma.
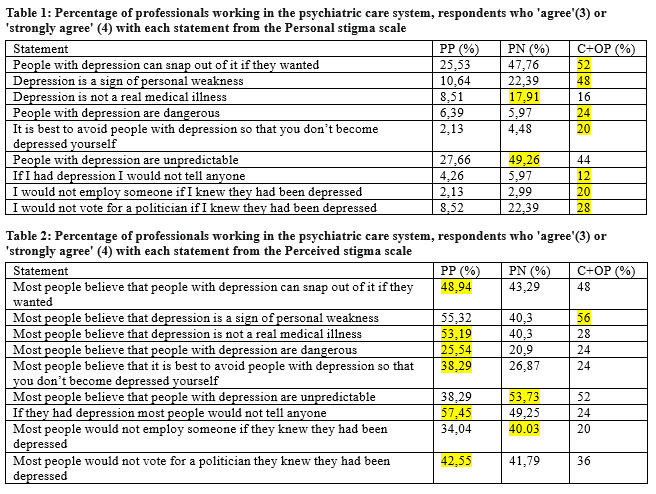
Perceived stigma
Tables 2 show the results for the perceived stigma set of questions from the perceived stigma scale. Overall, perceived stigma was substantial, with percentage of respondents endorsing a statement from the Perceived stigma scale ranging from 25,54% to 57,45% among the psychiatrists and psychologists subgroup that have the highest levels of perceived stigma to all statements except for the statement “Most people believe that depression is a sign of personal weakness” where carers and other professions score a little higher 56% compared to 55,32% and to the statetements” Most people believe that people with depression are unpredictable” and ‘Most people would not employ someone if they knew they had been depressed” where nurses have highest scores 53,73% and
40,03%.
Limitations
This study has a number of limitations. First, relatively small number of respondents. Secondly, the survey is not a representative national survey, the respondents coming from two psychiatric hospitals. Finally, the different organizational culture of the two institutions may reflect differences in interpretation of questions, and cultural factors that affect interviewee responses.
Conclusion
Given the high level of personal stigma among carers and other professions working in a psychiatric hospital it is necessary to evaluate what type of interventions can be employed so that the levels of personal stigma decrease. The same applies for the high levels of perceived stigma among the highest trained subgroup of professionals. Finally, the study reported here represents the first comparative survey of stigma among professionals working in the psychiatric system of care in Romania. The current work provides a baseline for tracking the level of stigma of professionals into the future. The information from this survey could provide valuable information to those who decide the antistigma strategies in the country.
REFERENCES
1.Beldie A., den Boer, J.A., Brain C., et all, Fighting stigma of mental illness in midsize European countries, Soc Psychiatry Psychiatr Epidemiol (2012) 47 (Suppl 1):1–38 DOI 10.1007/s00127-012-0491-z.
2.World Health Organization: Mental Health: New Understanding, New Hope. Geneva, World Health Organization; 2001.
3.Hinshaw SP, Cicchetti D: Stigma and mental disorder: Conceptions of illness, public attitudes, personal disclosure, and social policy.
Dev Psychopathol 2000, 12:555-598.
4.McNair BG, Highet NJ, Hickie IB, Davenport TA: Exploring the perspectives of people whose lives have been affected by depression.
Med J Aust 2002, 176Suppl:S69-76
5.Hocking B: Reducing mental illness stigma and discrimination – everybody’s business. Med J Aust 2003, 178:S47-S48.
6.http://www.who.int/mental_health/action_plan_2013/en/
7.Wells JE, Robins LN, Bushnell JA, Jarosz D, Oakley-Brown MA: Perceived barriers to care in St. Louis (USA) and Christchurch (NZ): reasons for not seeking professional help for psychological distress. Soc Psychiatry Psychiatr Epidemiol 1994, 29:155-164.
8.Corrigan PW, Edwards AB, Green A, Diwan SL, Penn DL: Prejudice,social distance, and familiarity with mental illness. Schizophr Bull 2001, 27:219-225.
9.Corrigan PW, Edwards AB, Green A, Diwan SL, Penn DL: Prejudice, social distance, and familiarity with mental illness. Schizophr Bull 2001, 27:219-225.
10.Link BG, Struening EL, Rahav M, Phelan JC, Nuttbrock L: On stigma and its consequences: Evidence from a longitudinal study of men with dual diagnoses of mental illness and substance abuse. J Health Soc Behav 1997, 38:177-190.
11.Griffiths, K. M., Nakane, Y., Christensen, H., Yoshioka, K., Jorm, A. F., & Nakane, H. (2006). Stigma in response to mental disorders: a comparison of Australia and Japan. BMC Psychiatry, 6, 21. http://doi.org/10.1186/1471-244X-6-21
12.Griffiths KM, Christensen H, Jorm AF, Evans K, Groves C: Effect of web-based depression literacy and cognitive-behavioural therapy interventions on stigmatising attitudes to depression: randomised controlled trial. Br J Psychiatry 2004, 185:342-349.
13.http://www.who.int/hrh/statistics/spotlight_2.pdf
***