BIOMARKERS IN FOLLOW-UP TREATMENT OF ALCOHOLISM WITH HEPATIC COMORBIDITY. AN OBSERVATIONAL STUDY
Abstract
The aim of this paper is the evolution of the biological markers and of alcoholism when the patient diagnosed with alcoholism is undergoing detox treatment. After detox, the biological markers of alcoholism undergo changes as the patient undergoes treatment. As a result of the successive visits for the detox treatment from alcohol, correlations were identified between GGT, GPT and GOT values in the group of patients diagnosed with alcoholism, as well as in the group of the patients with alcoholism and associated hepatopathy. The study aims to investigate a group of patients diagnosed with alcoholism that undergo the detox treatment and the manner in which the biological markers evolve in the case of the patients with alcoholism and associated hepatopathy. The results of the study will be capitalized in the form of a statistical and mathematical model so that clinicians can establish strategies for therapeutic approach for patients with relapses in alcoholism and hepatopathy associated to alcoholism.
INTRODUCTION:
Alcohol is the most widespread substance used for addictive purposes. According to WHO (1), worldwide consumption in 2010 was equal to 6.2 litres of pure alcohol per year consumed by people over 15 years of age, which translates to about 13.5 grams of pure alcohol per day (2,3). In Romania, the average consumption per capita in 2010 was 14.4 litres per year, while the European average was 10.9 litres per capita (1,2,4).
Monitoring abstinence and resumption of consumption at patients in a strict treatment program is of utmost importance. It has been noted that patients who undergo alcohol tests during these programs strictly follow therapy sessions, miss the sessions less and relapse less. A very appropriate test is the determination of carbohydrate- deficient transferrin (CDT). It highlights abstainers better than GGT or MCV due to better sensitivity and because its level is not that affected by hepatic suffering. On the other hand, relapse is well documented by the GGT level or the combination of GGT and transaminases (5). It is worth mentioning that the GGT level lacks accuracy as an independent marker but is considered to be useful in combination with CDV or MCV level according to Javros (6) GGT was much more sensitive than CDT (P <0.05), and MCV (P <0.001). The combination of CDT and GGT had a sensitivity of over 90%, meaning that average alcohol consumption in the 30 days prior to the blood test had a significant effect on CDT and GGT, but not on MCV. In conclusion, GGT is the most sensitive of these three markers, by using GGT and CDT in combination, sensitivity can increase to over 90%. The period of abstinence before blood tests have a major influence on GGT and CDT. If a long period of abstinence is present, MCV can also be measured to detect alcohol consumption at risk (7-8).
AST and ALT transaminases are enzymes involved in the metabolism of amino acids, constituent elements of protein blocks. ALT is the most specific marker for alcohol-induced liver disease because it is predominantly found in the liver, while AST is found in several organs including liver, muscle, kidney, and brain. High increases in these enzymes (more than 500 units per liter) may indicate alcohol-induced liver diseases. However, an increase in transaminases is not specific to alcohol-induced liver diseases; the increase may also occur in alcoholic hepatitis (8,10,14).
Liver disorders determined by alcohol consumption cause mitochondrial deterioration and the mitochondrial AST fraction is released in the blood, contributing to the increase of AST level in blood circulation.
An increase in the mitochondrial fraction demonstrates that AST is a sensitive marker and specific to liver destruction in a direct relationship with alcohol consumption of up to 2-3 days (9,11,13).
The analysis of the specialized literature revealed the specialists’ interest in the study of biological markers in relation to alcoholism. Opinions expressed by specialists show the impact over time of the effects of alcoholism on the patients’ health state quantified on the basis of these markers. In this context, I considered useful a study that exploits the research directions presented by specialists in the specialty literature with the observational methods of patients admitted for detox in specialized medical units. Thus, the proposed study quantifies for periods between admissions for detox the impact of drug treatment and counselling at admission for detox treatment in order to reduce the effects of alcoholism quantifiable through biological markers (especially in patients with hepatopathy associated with alcoholism).
STUDY DESIGN. METHODOLOGY:
The study focuses on the observational analysis of a group or batch of patients diagnosed with ethanolic dependence (331 patients (T.E.- witness batch ) out of which 202 patients were diagnosed with alcoholic hepatopathy (H.P. – experimental batch)), the patients are aged between 18-81 years old according to ICD 10 and DSM-IV.
Observational analysis was used as a method of study which was carried out over a two-years’ time interval between 2014-2016, on a batch of patients who were hospitalized in Elisabeta Doamna Galati Psychiatric Hospital.
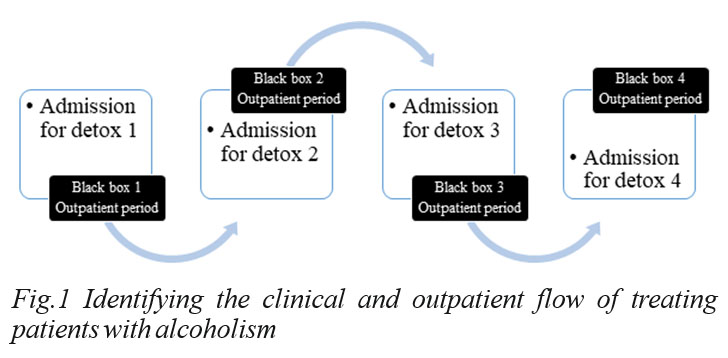
O b s e r v a t i o n a l a n a l y s i s h a s b e e n u s e d cumulatively with statistical dissemination of collected information, data series analysis and critical interpretation of observations using the mathematical and statistical model. The method implied criteria segmentation of information and obtaining the experimental batch from the witness batch, with the indication that it was segmented according to the criterion of determining significant alcoholic hepatopathy (identification of hepatic dysfunctions by elevated biological markers values GGT, GOT and GPT). The mathematical and statistical model proposes to highlight the link between the modification of GGT, GOT and GPT in a four-detox enrolment sequence in patients with hepatopathy associated with alcoholism. It also seeks to identify the influence of detox treatment at admission for detox on the behaviour in the outpatient periods considered by the model as being „Black Box” periods. The ethical and conduct norms regarding clinical research were complied with, patients’ agreement (written consent) was obtained and conflicts of interest were avoided for this study.
Observational data were statistically synthesized by applying their qualitative transformation, the results being disseminated on relative values, regarding the evolution of symptoms associated with alcoholism, in four distinct observational sequences (visits) made by the author on the witness batch (T.E.) of 331 patients within the timeframe specified above.
Thus, the updated Gretl version 3 program was used for this, regarding the econometric data library and time series with March 2018. At the same time, the Excel modules of the Office package, version 2013, were used. The transformations of the quantitative data into qualitative data were performed on the basis of relative weights and frequency ranges, averages, standard deviations for structural indicators (age, gender, urbanization, and admission period for detox) were calculated. Statistical tests were used (Breusch-Pagan heteroscedasticity analysis, t-Student test, forecasts for confidence intervals 95%).
Relative weightings have been highlighted for associated comorbidities such as hepatopathy, polyneuropathy, epilepsy, heart disease and other comorbidities associated with alcoholism.
The study aims to assess the impact of alcoholism on changes in biological markers in patients with associated hepatopathies. In order to achieve this goal, the author took into account the following objectives:
1. Delineation of the sub-sample of patients with alcoholic hepatopathy from the total sample.
2. Calculation of differences between the relative values of comorbidities risk in alcoholism as compared to the comorbidities risk in alcoholism and associated hepatopathy.
3. Assessing the results of the biomarkers GGT, TGP, GOT, in relation to the reference interval of biomarkers for determining the polarization of the sample on the critical area and highlighting the impact difference of polarization for alcoholic patients as compared to patients with associated alcoholic hepatopathy.
4. Building an econometric model on the data resulted, based on the smallest squares method for assessing the impact of alcoholism on changes in the biological markers (patients with hepatopathy associated with alcoholism vs. total patients with alcoholism).
RESULTS:
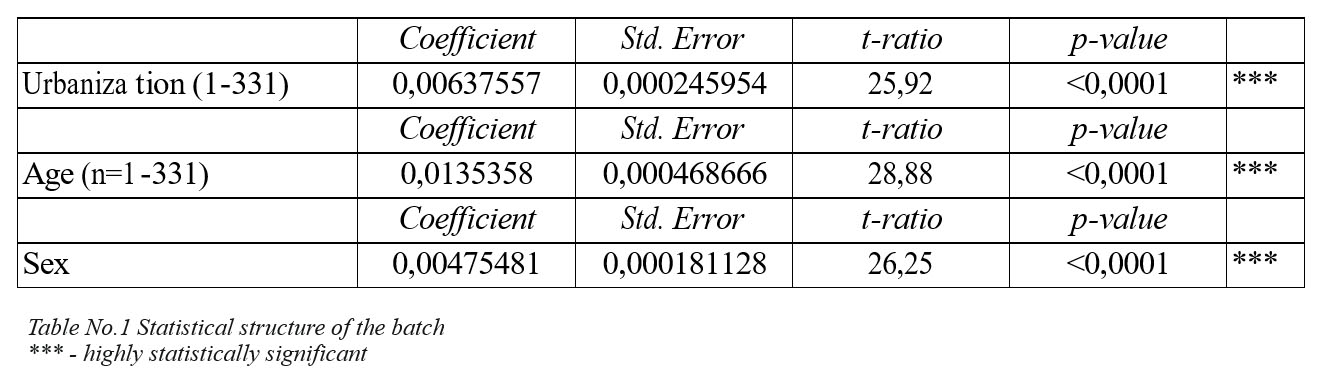
The average distribution of the phenomenon in the urban environment according to the witness batch of 331 patients is 60% at a standard error of 0.0002 with a t ration of 25.92 and p-value <0.0001.
The statistical analysis of the observational study on a batch of 331 patients with alcoholism out of which 202 patients with hepatopathy associated to alcoholism highlighted the following conclusions:
- The age of patients is predominantly in the range between 40-60 years (50%)
and over 60 years (25%), thus the alcoholism affects the mature people, especially men (92.45%) in urban areas (60%).
- Patients with hepatopathy associated to alcoholism are predominantly people
aged 40-60 years (55% - 10% more than those in the witness batch), predominantly men (94.55%) in urban area (53.47%).
The comparative analysis of the experimental batch structure as to the witness batch structure reveals an increase in the polarization rate of male individuals from the batch at the level of hepatopathy associated to alcoholism and a more balanced distribution of urbanization phenomenon, in the sense of decreasing its impact (from 60 to 53.47%).
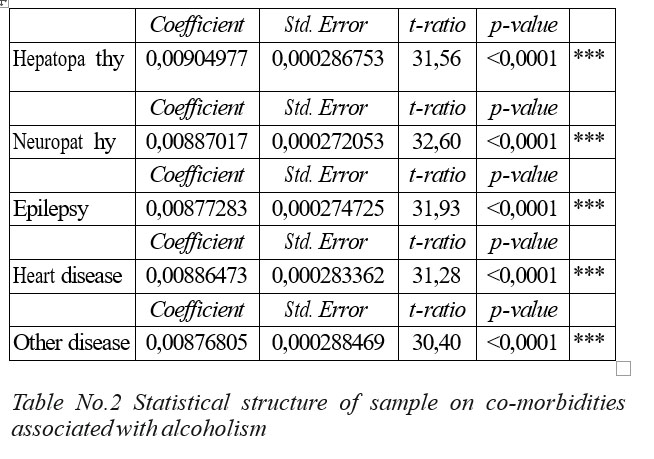
The statistical distributions values were calculated by the simple linear regression model in the table below (the standard error values, the statistical significance-p value and the t-ratio were determined). These values were obtained through the Gretl program using the observations made in the observational study according to the method presented in the previous paragraph.
Comorbidity analysis for patients with alcoholism was performed on the basis of observations from the observational study of the witness and experimental batch, resulting in a high incidence of hepatopathy in the witness batch and a significant incidence of polyneuropathy and epilepsy. Comorbidities were reported for heart disease and other conditions in statistically significant weights. During the next detox visits, visits 2-4, there was a reduction in comorbidities regarding neuropathy, epilepsy, heart disease and other comorbidities associated to alcoholism, while among hepatopathy in the witness batch level, the fluctuation increased up to the third visit for detox, then it returned to the distribution level from the first visit, characterized by the tendency line y = -0.027 x2.
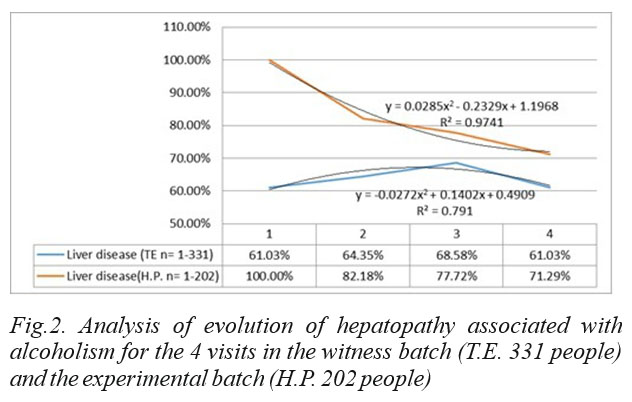
The data presented in the figure show that for the witness batch (TE – 331 people) in the first three visits the percentage of patients with alcoholic hepatopathy in relation to the total number of patients has increased and at the fourth visit their number decreased to 61,03% .
The experimental batch shows that from visit 1 to visit 4, the percentage of patients with alcoholism and associated hepatopathy was continuously decreasing (visit 2 – 82.18%, visit 3-77.77% and at visit 4 it reaches 71, 29%).
The trend lines are convergent reflecting flattening following successive visits to detox of the differences in hepatic impairment between the witness batch and the experimental batch, which will be studied extensively in the mathematical and statistical model. The other comorbidities were studied at the relative data level, by frequency weights of the comorbidity incidence in the witness batch and the experimental batch, as shown in the figure below:
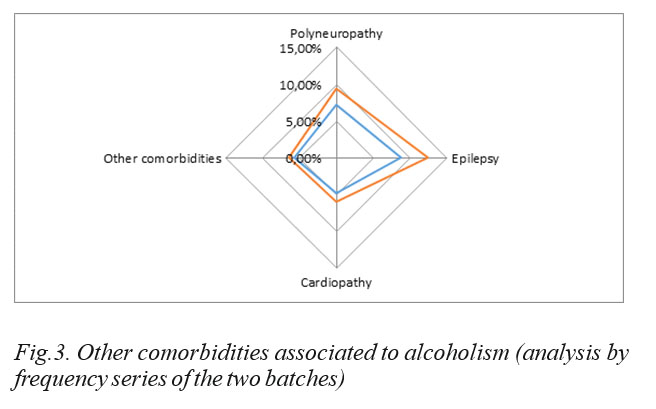
There is a higher distribution in patients with hepatopathy associated in alcoholism.
The analysis of statistical distributions and statistical significance by p-value is shown in the table below:
The biomarker analysis for the witness batch reveals that alcoholism affects predominantly biomarkers, with values above the maximum critical threshold for GGT, GOT and GPT. There are some cases (between 1 and 3%) where the values are below the critical minimum. The average share for the 4 detox visits of the GGT values in the witness batch is around 57.25% for the GOT, the share being 60.73% and the GPT being 45.77% (critical values of the biomarker). The situation will continue dynamically.
The observational study shows that the percentage of patients with elevated GGT is decreasing from visit 1 to visit 4 for detox. Also the number of patients with GOT and GPT values over the limit in alcoholic patients and associated hepatopathy decreased as a percentage from visit 1 to visit 4, the detox phenomenon positively influencing the condition of the patient with alcoholism and associated alcoholic hepatopathy.
Table 3 shows that the number of patients with GGT above the limit is higher in the batch of patients with associated hepatopathy as compared to the total batch of patients diagnosed with alcoholism. The number of patients with GOT and GPT above the limit is higher in the batch of patients with associated alcoholic hepatopathy as compared to the number of patients in the total batch.
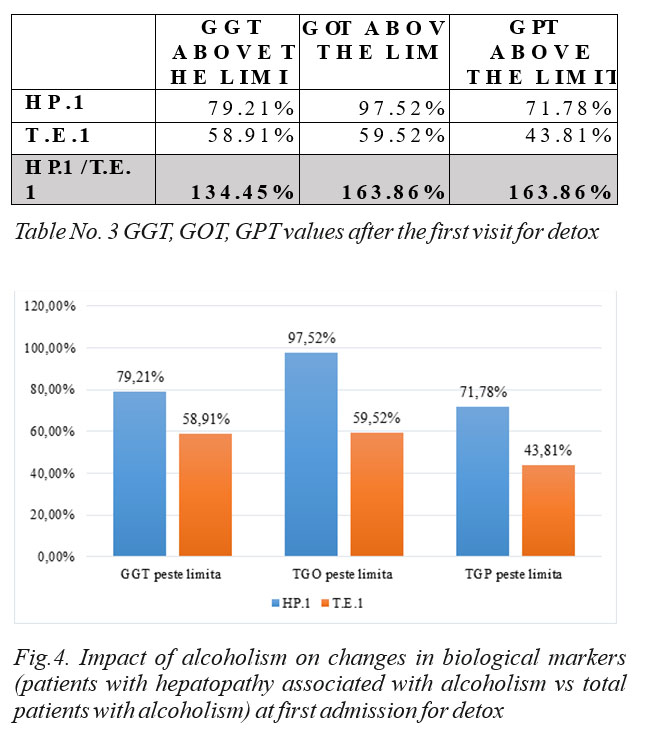
From the analysis of the biological markers changes at the first admission for detox, it can be seen that the percentage of GGT with values above the limit is of 79.21% in the batch of patients with alcoholic hepatopathy and 58.91% in the total batch of patients with alcoholism. Patients who showed GOT values above the limit were 97.52% in the batch of patients with alcoholic hepatopathy and 59.52% in the batch of patients with alcoholism.
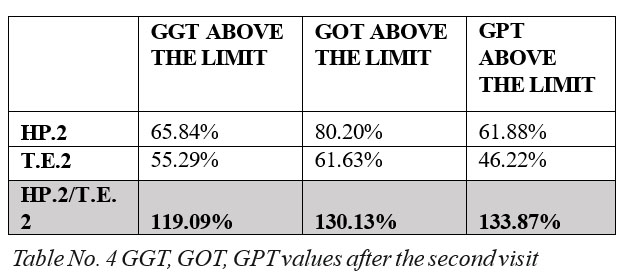
At the second detox visit, the percentage of patients with associated hepatopathy versus total batch was decreasing with respect to GGT (119.09%), GOT (130.13)% and GPT (133.87%).
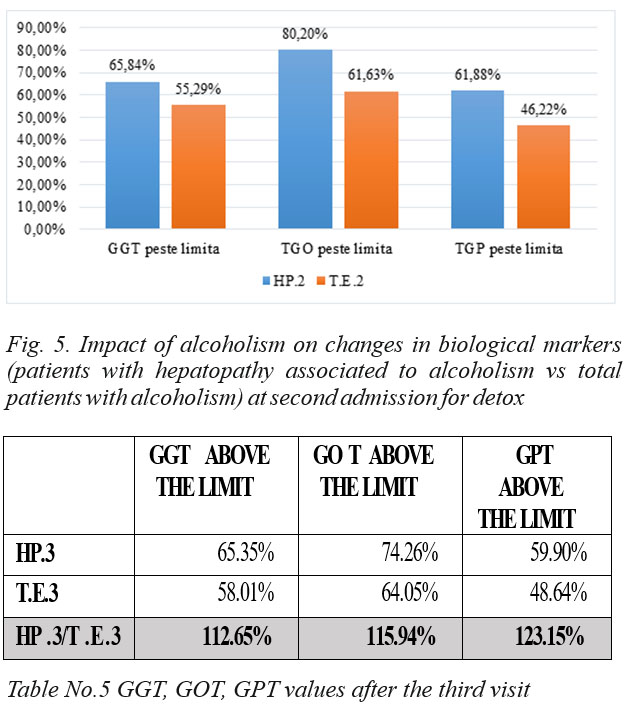
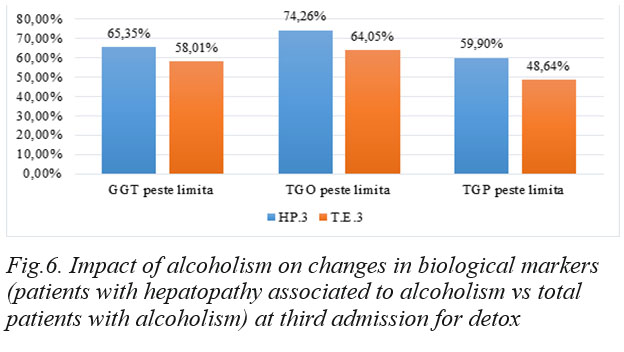
As compared to visit 2, the percentage of patients with associated hepatopathy versus the total batch was continuously decreasing with regard to GGT (112.65%), GOT (115.94)% and GPT (123.15%) .
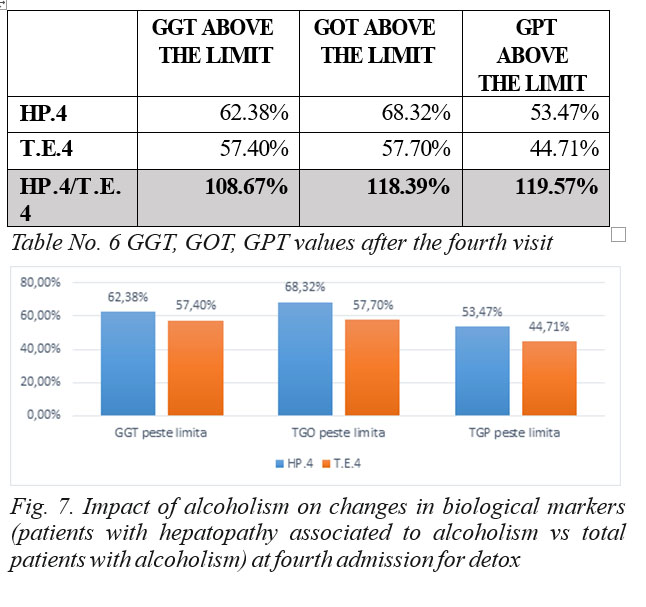
At the last detox visit, the percentage of patients with associated hepatopathy continued to decline for GGT (108.67) and GPT (119.57), but GOT (118.39) showed a non-significant statistical increase.
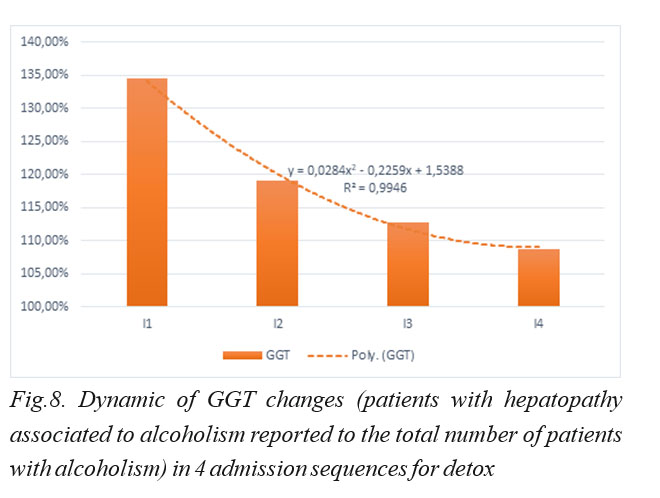
The above graph shows that GGT in patients with associated alcoholic hepatopathy has a downward trend in the form of the curve shown above from visit 1 to visit 4, thus detox has a favorable impact on patients with hepatopathy associated to alcoholism.
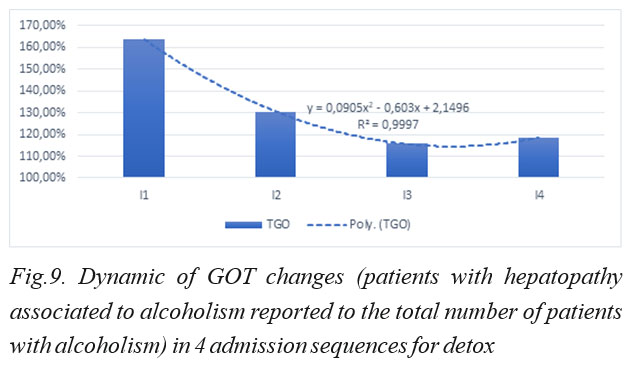
It can be seen in the above graph that in patients with hepatopathy associated to alcoholism the percentage of GOT has a downward trend in the curve shown above from visit 1 to visit 3. At the fourth visit to detox, the curve exhibits a slight ascendant evolution, but insignificant from a statistical point of view.
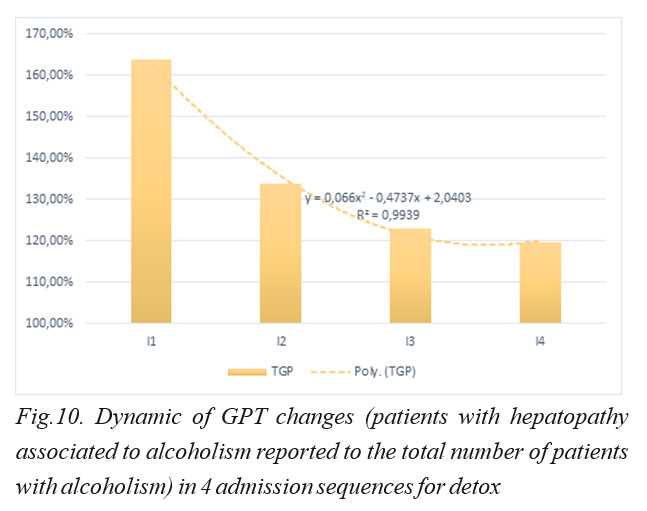
In the above graph it can be seen that GPT in patients with hepatopathy associated to alcoholism has a downward trend in the above curve from visit 1 to visit 4 so that detox has a favorable impact on patients with hepatopathy associated to alcoholism.
DISCUSSIONS:
The information presented led to the need to evaluate the changes in GGT sequential values in relation to GPT and GOT biological markers to observe the impact of detox on changes in biomarker values in patients with alcoholism, respectively, with alcoholism and associated hepatopathy.
This evaluation involves the regression analysis of the differences between the relative data of the elevated levels of GGT, GOT and GPT biomarkers at the four detox visits in the two batches, witness and experimental, as calculated in Tables 3-6 (H.P.n/T.E.n values, n=1÷4).
Regression analysis will reveal valuable data for the treating physician regarding the correlation of biomarkers, data that can be interpreted using a statistical model, so that by applying it, a general image of the patient’s clinical picture containing the current and historical data, highlighting possible syncope in treatment or during the period of relapses in alcoholism after detox.
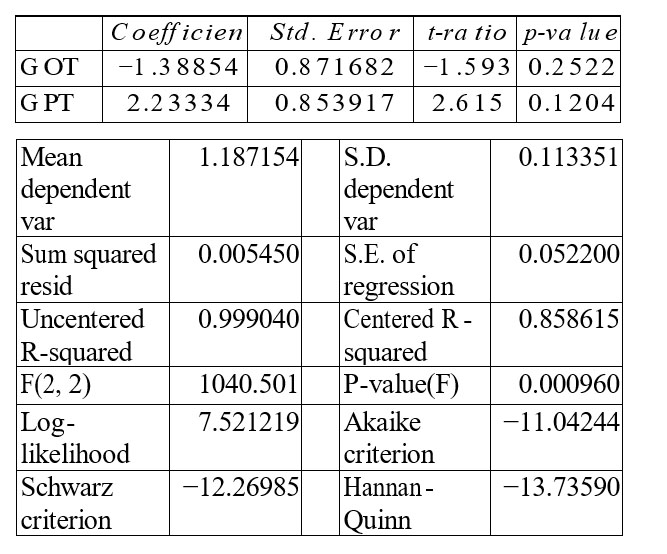
The statistical model drafted on the basis of observational analysis outlines the impact of alcoholism, as reflected by the GGT (dependent variable) biomarker in relation to the GOT and GPT (regressor) biomarkers for the four detox visits and reflects the analysis of the evolution of hepatopathy associated to alcoholism after detox treatments among an alcoholic population (witness batch) and a population with alcoholism and hepatopathy associated to alcoholism (the experimental batch), which can become a valuable tool for clinician physicians following the implementation of a medical procedure of collecting the patien’s medical history data, their centralization and statistical processing based on the proposed model. The correlation of the dependent variable with the regressors reflects the direct relationship of the evolution of hepatic impairment indicators while undergoing detox, so that the proposed model evaluates the achievable predictability degree of the evolutionary curve flattening of the hepatopathy associated in alcoholism, phenomenon highlighted in Figure 1. The regression model determined by the linear regression method is as follows:
GGTH.P./T.E.=α*TGOH.P./T.E.+β*TGPH.P./T.E+ε, where GGT – dependent variable GOT and GOT – regresors α, β – variabile,
ε – residual variable
The analysis of the observations collected in Tables 4-6 through the Gretl program has generated for the statistical and mathematical model the following equation whose statistical representativity is greater than 99.99%.
Model with equation: ^GGT = – 1.39*TGO + 2.23*TGP (0.872) (0.854) n = 4, R-squared = 0.999 (standard errors in parentheses),
is 99.99% representative for the phenomenon analysed, namely the detox process from alcoholism has significant influence on the reduction of GGT (dependent variable), GPT and GOT (regressive variables), in the sense of flattening the differences between patients with alcoholism and patients with hepatopathy associated to alcoholism. The statistical tests demonstrating the representativeness of the model are presented below:
Model 1: OLS, using observations 1-4
Dependent variable: GGT
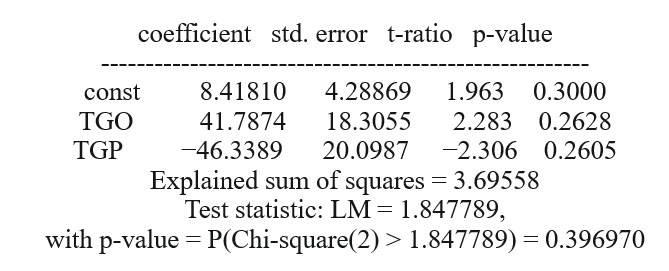
The heteroskedasticity analysis made using the Breusch-Pagan test shows that in the null hypothesis heteroskedasticity is not present, the value p = 0.39, respectively 0.19 in the robust variant of the Chi square test greater than 1.84 and 2, respectively.
Breusch-Pagan test for heteroskedasticity
OLS, using observations 1-4
Dependent variable: scaled uhat^2
The evolution on the confidence interval of 95% indicates a minimal difference between the predicted evolution of GGT and the prediction (FORECAST) assessed by the T test through the four observational sequences (visits) with minimum differences of the standard error (0.01).
Based on the data presented, it results that the model is homogeneous, well-defined and representative of the phenomenon studied, namely the impact of alcoholism on changes in biological markers (flattening differences between patients with hepatopathy associated to alcoholism – experimental batch and total number of patients with alcoholism-witness batch).
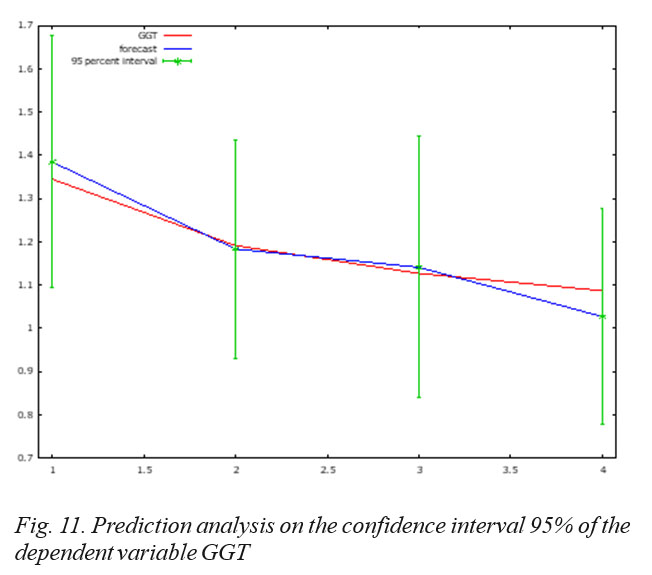
For 95% confidence intervals, t(2, 0.025) = 4.303
GGT Prediction Std. error 95% interval
I1 1.344504 1.384301 0.067664 1.093167 – 1.675435
I2 1.190905 1.183014 0.058794 0.930044 – 1.435984
I3 1.126547 1.140501 0.070279 0.838116 – 1.442886
I4 1.086660 1.026586 0.058094 0.776628 – 1.276544
CONCLUSIONS:
Detoxification (detox) is the first stage in the treatment of alcohol addiction.
The detox has a natural direct influence (in the sense of reducing the biomarkers values) on patients with alcoholic hepatopathy. The difference between the biomarkers values for patients with and without hepatopathy in alcoholism tends to decrease after detox. It has been clearly noticed that at patients with two or more detox treatments, there is a clear tendency of normalization of all biomarkers.
In the work presented using the observational method, data were collected for a group of patients with repeated relapses in alcoholism (4 visits for detox), the collected data being then statistically interpreted by means of a mathematical regression model.
For the periods between detox visits the study confirms maintaining sustained treatment effects (detox after repeated relapses) up to the IIIrd detox visit meaning an average spread of 1.18% between the dependent variable of the model (GGT) and its predicted value for the confidence interval of 95% (Fig.3). At the IVth visit, the prognosis evolution in the 95% confidence interval has a trend change relative to the GGT variation (dependent variable), resulting in a negative spread of 5.53% (1.026586 vs. 1.086660), which represents a 4-time reverse change in the trend registered until the third visit to detox.
The conclusions of the study materialized in the form of a statistical model proposal allow the development of a medical procedure where the patient’s historical data are correlated with the data collected at the detox visit so that a diagnosis can be possible based on biomarkers in the context of evaluating changes in biomarkers in patients with hepatopathy associated to alcoholism.
The proposed statistical and mathematical model reveals the impact of detox on patients with hepatopathy associated with alcoholism, and can be used in early appropriate treatments based on biomarker-assisted diagnosis for patients diagnosed with alcoholic hepatopathy. After the detox stage (detox), the treatment of alcohol addiction requires a relapse prevention stage involving several therapeutic options. The standardized approach that we propose may suggest choosing the right option, time sequence of different bio-psycho-social options, and the assessment of remission and recovery over time of patients in view of the most appropriate plan for resuming vocational activities, their statute and social roles.
The proposed model is an innovative one based on clear information gathered over a period of 2 years from a statistically representative sample of 331 people, which allowed obtaining a statistically representative depiction of the phenomenon of 99.99%. The proposed tool can be integrated into a software program that will ease the mission of the treating physician by enhancing historical information with current information and highlighting possible syncope in treatment or during the periods of relapse in alcoholism after detox.
For the periods between detox visits, the study confirms the preservation of a treatment redundancy up to the 3rd detox visit in the sense of an average difference of 1.18% between the dependent variable of the model and the predicted dependent variable for the 95% confidence interval (Fig. 3). At the 4th visit, the evolution of the predicted straight line changes its direction from the trend line of the dependent variable, resulting in a negative difference of 5.53% between the two straight lines (1.026586 as compared to 1.086660), the difference which represents a 4 times reverse change of the registered trend until the third visit for detox.
The proposed statistical and mathematical model reveals the impact of detox on patients with hepatopathy associated to alcoholism and can be used to establish appropriate early treatments based on diagnosis sustained by the biomarkers values for patients diagnosed with alcoholic hepatopathy.
REFERENCES:
1.World Health Organisation – Global status report on alcohol and health 2014, Louxembourg, WHO Library Cataloguing-in-Publication Data 2014; 7-12.
2.Chisholm D, Rehm J, Van Ommeren M, Monteiro M. Reducing the global burden of hazardous alcohol use: a comparative cost- effectiveness analysis. J Stud Alcohol 2004; 65:782−934.
3.Ghid De Prevenție. Stilul de viață sănătos și alte intervenții preventive prioritare pentru boli netransmisibile, în asistența medicală primară Vol. 3. Intervențiile preventive adresate stilului de viață. Consumul de alcool 2016.
4.Ur Rahman I, Idrees M, Salman M, et al. A comparison of the effect of glitazones on serum sialic acid in patients with Type 2 diabetes. Diab Vasc Dis Res 2012; 9(3):238–240.
5.Javors MA, Johnson BA. Current status of carbohydrate-deficient transferrin, total serum sialic acid, sialic acid index of apolipoprotein J and serum beta-hexosaminidase as markers for alcohol consumption 2003; Addiction 98(Suppl. 2):45–50.
6.Mundle G, Ackermann K, Munkes J, Steinle D, Mann K. Influence of age, alcohol consumption and abstinence on the sensitivity of carbohydrate-deficient transferrin, γ- glutamyltransferase and mean corpuscular volume. Alcohol and Alcoholism 1999; 34, 760–766.
7.Halvorson MR, Campbell JL, Srague G et al. Comparative evaluation of the clinical utility of three markers of ethanol intake: the effect of gender. Alcohol Clin Exp Res 1993;17:225–9.)
8.Macchia T, Mancinelli R, Dell’Utri Aet al. Quantificazione dell’alcolemia per studi epidemiologici nella prevenzione degli incidenti stradali. Bollettino Medici Italiani dei Trasporti 1991; 2:5–19.
9.Harper C. The neuropathology of alcohol-related brain damage. Alcohol Alcohol 2009, 44: 136-140.
10.Imbert-Bismut F, Naveau S, Morra R, Munteanu M, Ratziu V, Abella A, Messous D, Thabut D, Benhamou Y and Poynard T. The diagnostic value of combining carbohydrate-deficient transferrin, fibrosis, and steatosis biomarkers for the prediction of excessive alcohol consumption.
Eur J Gastroenterol Hepatol 2009; 21: 18-27.
11.Sorbi D , Boynton J, Lindor KD. The ratio of aspartate aminotransferase to alanine aminotransferase: potential value in differentiating nonalcoholic steatohepatitis from alcoholic liver disease. Am J Gastroenterol 2001; 94: 1018 – 1022 .
12.Charles S L. Blood Markers of alcoholic Liver Disease, World J Gastroenterol 2014; 15(20):351-365.
13.Prelipceanu D. Abuzul de substanțe psiho-active, în: Prelipceanu D.(ed)-Psihiatrie clinică, Ed.Med., Buc. 2011, 205-350.
14.Vonghia L, Michielsen P, Dom G and Francque S. Diagnostic challenges in alcohol use disorder and alcoholic liver disease. World J Gastroenterol 2014; 20(25): 8024–8032.
***