PERCEPTION OF QUALITY OF LIFE AND DISABILITY AMONGST PATIENTS WITH SCHIZOPHRENIA: DIFFERENCES BETWEEN GENDERS
Abstract
Introducere: diferențele între sexe în cadrul schizofreniei au fost studiate în numeroase domenii pornind de la caracteristicile socio-demografice, continuând cu aspecte legate de boală, până la diferențe legate de impactul bolii asupra calității vieții individului. Numeroase studii au raportat grade înalte de dizabilitate precum și o calitate a vieții scăzută în schizofrenie. Obiectiv: scopul articolului este de a identifica diferențele între percepția calității vieții și a dizabilității, corelate atât cu caracteristici socio-demografice cât și cu aspecte legate de boală. Metode: Au fost incluși în studiu 143 de pacienți cu diagnostic de schizofrenie. Pentru evaluarea acestora s-a folosit: scala PANSS (Positive And Negative Syndrome Scale), chestionarul pentru evaluarea calității vieții al Organizației Mondiale a Sănătății- varianta scurtă (WHO-QOL-Bref), iar pentru evaluarea dizabilității a fost utilizat Chestionarul de evaluare a dizabilității (Disability Assessment Schedule- WHO DAS II)- varianta cu 36 de itemi Rezultate: Există diferențe semnificative între sexe în ceea ce privește vârsta ( p<0,001) și statutul marital (p<0,001). În funcție de sex, nu sunt înregistrate diferențe semnificative statistic în ceea ce privește nivelul psihozei evaluat cu scala PANSS, nici pentru scorul total (p=0,402), nici pentru scorul pozitiv (p=0,330), scorul negativ (p=0,400) și scorul patologie generală (p=0,693). Comparativ cu persoanele de sex feminin, persoanele de sex masculin înregistrează scoruri mai mari pentru toate dimensiunile calității vieții măsurate pe scala WHO-QOL- BREF, totuși diferențe semnificative statistic sunt observate numai pentru dimensiunile Sănătate Fizică (p<0,01) și Psihologic (p<0,05). Există diferenţe semnificative ale valorilor medii ale scorului WHO-DAS II între persoanele de sex feminin şi cele de sex masculin numai pentru dimensiunea Mișcare (p<0,001). Pentru această dimensiune persoanele de sex feminin înregistrează valori medii mai mari ale scorurilor WHO- DAS II Concluzii: Se constată o tendință a pacienților de sex masculin de a raporta o calitate mai bună a vieții și grade mai reduse de dizabilitate.
INTRODUCTION
Schizophrenia is a chronic, invalidating psychiatric illness that interferes with all major functioning domains. Typically the incidence was reported as equal in both males and females, although more recent studies reveal a higher incidence among males. (1)
Throughout time there has been an interest in studying differences between genders in several areas, such as age of onset, typical symptoms, pre-morbid level of functioning and progression features.
Females have been reported to have an later onset age, by a mean of 5 years; peak incidence being between the ages of 21 and 25 for females and 25 and 32 for males. (2) Females have a second incidence peak in the forth decade of life. (3)
Evidence from several studies suggest that in female patients there is a lower negative impact on life quality deriving from a lower number of hospital admissions and a shorter average of days spent in hospital in one admission (4), a faster remission on lower neuroleptic drugs doses than male patients (5). Despite these findings, difference between genders in long term prognosis tends to be smaller, mainly because there is a faster deterioration rate in females at older ages (6).
There have not been reported major differences between genders where positive symptoms and formal thought disorders (7) are concerned in most studies, but there are differences concerning clinical expression of these alterations, substance abuse and anti-social behavior for instance being more frequent in male patients (4, 7). Symptoms from the affective cluster are more frequent in females (8) and negative symptoms tend to be more frequent in males; this seems to be rather a primary result of the pathological process (9).
Quality of life has been a major area of interest in the last few years where mental illness is concerned. This concept is a multi-dimensional one and includes domains related to health but also social ones, like work, family, religion, and environment. Due to these multiple aspects quality of life is characterized mainly by individuality and subjectivity (10,11). The most practical definition is that quality of life represents an individual’s perception of his or hers position in life in a cultural and personal value systems context, according to objectives, expectations and standards (12). Numerous studies tried to asses quality of life for schizophrenic patients, concerning both demographic and social aspects (age, marital status, etc) and pathological ones (symptoms, response to treatment, etc.)
Disability is a complex phenomenon which entails interaction between body features of an individual and features of the society in which that individual lives (13). Therefore, mental disability should reflect, or derive from an individual’s deficits influencing his/hers learning, livinf and working environments (14).
MATERIAL AND METHOD
We have included in this study 143 individuals diagnosed with schizophrenia (according to DSM-IV- TR), admitted in “Prof dr Alexandru Obregia” Clinical Hospital of Psychiatry. Patients included in the study were aged between 19 and 60 and have signed an informed consent form regarding enrolling in this study. Protocol and text for the informed consent was approved by the hospital’s ethical committee. Patients with history of alcohol/substance abuse, as well as those diagnosed with mental retardation were excluded.
PANSS scale (positive subscale, negative subscale, general pathology subscale and total score) was used to evaluate symptoms.
To asses quality of life patients were asked to respond to World Health Organization’s life quality questionnaire (short form- WHO-QQL-BREF), which consists of four sub-domains (physical health, psychological domain, social relations and environment domain) and two general questions.
To evaluate disability we used Disability Assessment Schedule- WHO DAS II (the 36 items version). This questionnaire is comprised of questions regarding 6 areas: understanding and communication, movement, self care, relating to other individuals, life activities and social participation.
Statistical Analysis: was performed using Mean Scores, Standard Deviation, independent-samples t test for scale variables and chi-square test of association (Chi- Square, Cramer’s V) for nominal variables.
The T test for independent samples was used to describe the gender significant differences in patients’ age, duration of illness and age of illness onset. The Chi- Square and Cramer’s V test were used to describe the gender significant differences in patients’ education level and marital status. The t test for independent samples was used to describe the gender significant differences in average values of PANSS, WHO-QOL-BREF, WHO- DAS II scales.
Statistical analysis was done using SPSS version 20.
RESULTS
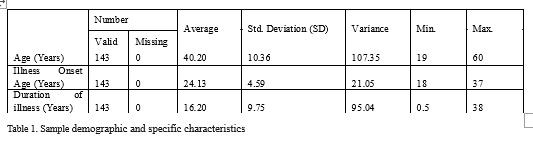
Sample characteristics: Socio-demographic characteristics- for this research, a number of 143 people were interviewed (84 women, 58 men). Age of subjects varies between 19 years and 60 years, with an average age of 40.2 years (SD = ±10.36 years).
Regarding the last school graduated, most subjects had completed secondary and post-secondary (42.8%) education levels, followed by those who have graduated from a vocational school (21.8%). Subjects with higher education represent a ratio of 19.1% from the sample, and those who have a primary level of education totals 16.4% percent. Regarding the marital status, the majority of subjects included in the study are single – 49.1%, a share of 25.4% being divorced or separated. Subjects involved in a married or cohabiting relationship represent a percentage of 24.6%. Only one of the subjects is widowed (0.9%)
Specific Characteristics: The onset age of illness for the subjects included in the study varies between 18 years and 37 years, with an average of 24.13 years (SD= 4.59 years). Duration of illness for the subjects is 16.2 years with a standard deviation of 9.75 years. It ranges from one year to 38 years (see Table 1)
Statistically significant difference by Gender – Socio-demographic characteristics Age
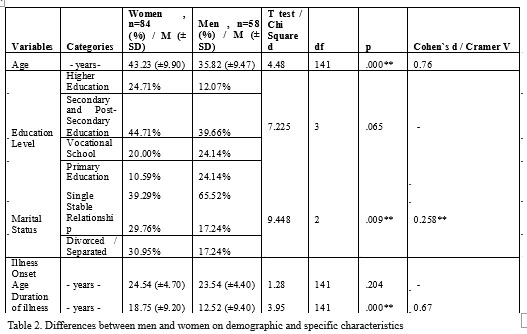
The average age for the women included in the sample is 43.23 years, with a standard deviation of 9.9 years. The average age of the men are lower than those of the female, namely 35, 82 years old, with a standard deviation of 9.47 years. Independent samples t test shows that the difference in age between the female and the male is significant (t = 4.477, df = 141, p <.001). The difference in age is 7.41 years ± 3.27 years. To estimate the effect size of the sex variable over the age was used Cohen `s d. Since the Cohen’s d value is below the 0.8 limit (Cohen`s d = 0.76) we can say that the effect is an average one.
Education level (see Table 2):
To calculate more precisely the significant gender differences in the level of education, the variable was redefined in four general categories: higher education, secondary and post-secondary education, vocational education and primary education.
The females have a higher educational level over the males surveyed. The percentage of women with secondary education, post secondary and higher education is 69.42%, compared with men, whose share is 51.73%, regarding the same level of education. The female also has a lower percentage of primary education (10.59%) than males (24.14%).
A Chi-square test of association was performed to determine whether there are significant gender differences in educational level. Although differences can be observed between the education level of the subjects included in the study according to sex, they are not statistically significant (Chi-squared (3) = 7.22, p> .05, Cramer’s V = .225, p>.05).
Marital status (see Table 2):
To calculate more precisely the significant gender difference in marital status, variable was redefined as three general categories: single (remained unchanged), stable relationship (include married persons and those i n v o l v e d i n a c o h a b i t a t i o n r e l a t i o n s h i p ) divorced/separated (including divorced or separated persons) and widow category was ignored (containing just a single case).
The ratio of unmarried males (65.52%) is higher than females’ ratio (39.29%) in the sample. Also, women (29.76%) are involved in a higher proportion than men (17.24%) in a stable relationship – marriage or cohabitation.
A Chi-square test of association was performed to determine whether significant differences in marital status by gender. The value obtained indicates significant differences between the two groups (Chi-squared (2) = 9.448, p <0.01, Cramer’s V = .258, p <.01). However, Cramer’s V value less than 0.30 allow us to conclude that although the relationship between the two variables is not random, it is rather poor. Onset age of illness (see Table 2) The average onset age of illness for the females is 24.54 years, with a standard deviation of 4.7 years and for males is 23.54 years, with a standard deviation of 4.4 years. Is observed a lower illness onset age for males. Independent samples t test indicated an insignificant difference in the average illness onset age between the females and males (t = 1.277, df = 141, p> .05).
Duration of illness(years)(see Table 2):
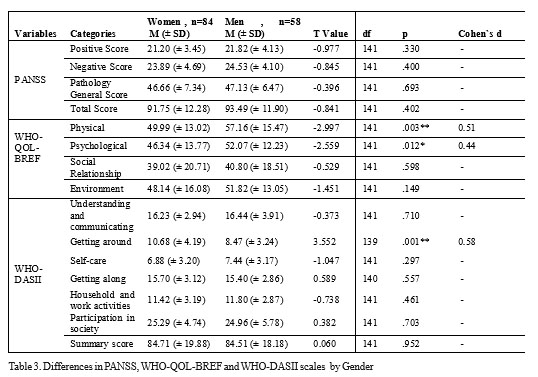
The average duration of illness for the females is 18.75 years with a standard deviation of 9.2 years. Compared with women, for mean illness duration less, being 12.52 years with a standard deviation of 9.4 years. Independent samples t test shows that the duration of illness’ difference between the female and the male is significant (t = 3.946, df = 141, p <0.001). The difference in duration of illness is 6.23 years ± 3.12 years. Cohen`s d coefficient is 0.67, which indicates a medium effect of the gender variable on duration of illness. Statistically significant difference by Gender – Instruments PANSS Average values of PANSS instrument dimensions are 21.45 (SD = 3.74) for Positive Score, are 24.15 (SD = 4.45) for Negative Score and 46.85 (SD = 6.98) for Pathology General Score. The PANSS Total Score for subjects in the sample is 92.46 (SD = 12.11). Compared to males, females included in the study registered lower average scores of both the PANSS dimensions and PANSS Total Score. Total PANSS score for the female has a value of 21.20 (SD = 3.45) and for males the score is 21.82 (SD = 4.13). Independent samples t test showed a not statistically significant difference in average values of PANSS Positive Score between the females and males (t = -0.977, df = 141, p> 0.05), or PANSS Negative Score too (t = -0.845, df = 141, p <0.05). Similarly, the average value of PANSS Pathology General Score (t = -0.396, df = 141, p> 0.05) and PANSS Total Score (t = -0.841, df = 141, p> 0.05) did not differ significantly depending on the sex of subjects.
WHO-QOL-BREF (see Table 3):
The average values of WHO-BREF dimensions scores range from 39.75 (SD = 19.79) for the Social dimension and 52.92 (SD = 14.46) for Physical dimension. The average value of WHO-QOL-BREF Score for Psychological dimension is 48.68 (SD = 13.42) and for Environment dimension is 49.65 (SD = 14.98).
Analyzing the average values by gender, we can notice that males registered higher scores for all WHO- QOL-BREF dimensions compared to the females.
Independent samples t test indicated a significant difference in WHO-QOL- BREF score between the female and male only on Physical dimension (t = -2.997, df = 141, p <0.01) and Psychological dimension (t = – 2.559, df = 141, p <0.01). Score differences between men and women are 7.17 ± 4.73 points for Physical dimension, respectively of 5.73 ± 4.42 points for the Psychological dimension. Gender variable effect on the scores of these specific dimensions is a rather average, Cohen`s d coefficients being close to the limit of 0.50 (Cohen`s d=0.51 for the Physical dimension and Cohen`s d=0.44 for Psychological dimension).
WHO-DAS II (see Table 3):
Average values of the six WHO-DAS instrument dimensions range from 7.11 (SD = 3.19) for Self-care dimension and 25.15 (SD = 5.17) for Participation in society dimension. The average value of WHO- DAS II understanding and communicating dimension is 16.32 (SD = 3.36), for Getting around dimension is 9.77 (SD = 3.97), for Getting along is 15.58 (SD = 3.01) and for Household and work activities is 11.57 (SD = 3.06).
Analyzing the average values by gender, we can notice that males registered higher average WHO-QOL- BREF scores for Understanding and communicating, Self-care and Household and work activities dimensions. Differences in mean scores of these dimensions, by gender, vary between 0.21 points for Understanding and communicating dimension and 0.57 points for Self-care dimension. Females registered higher averages WHO- DAS II scores for Getting around dimension, Getting along dimension and Participation in society dimension. Gender differences in average scores of these dimensions range from 0.30 points for Getting along dimension and 2.21 points Getting around dimension. Independent samples t test shows a statistically significant difference in WHO-DAS II mean scores between the female and male only on Getting around dimension (t = -3.552, df = 139, p <0.001). For the other five WHO-DAS II dimensions, T- test for independent samples revealed not statistically significant difference in recorded average scores between men and women (p> .05). Similar with previously mentioned dimensions, the WHO-DAS II Total score did not significantly differ by subjects gender (t = -0.60, df = 141, p> .05).
DISCUSSION
There are significant gender differences in terms of age (t = 4.48, df = 141, p <0.001) and marital status (Chi square = 9.45, df = 2, p <0.001). Females' average age is higher by 7.41 years ± 3.27 years, compared to men's age. The share of unmarried males (65.52%) is higher compared to the females (39.29%) included in the sample. Also, women (29.76%) are involved in a higher proportion than men (17.24%) in a stable relationship - marriage or cohabitation. Statistically significant differences by gender are not recorded in the education level (p> 0.05). Women have a significantly higher duration of illness by 6.23 (± 3.12) years compared with males. Gender differences observed in the age of illness onset are not statistically significant.
No statistically significant differences are recorded by gender regarding the level of psychosis, assessed with the PANSS scale, for total score (p = 0.402) nor the positive score (p = 0.330), negative score (p = 0.400) and overall pathology score (p = 0.693).
Compared to the females, males recorded higher scores on all dimensions of quality of life, measured by WHO-QOL- BREF scale, statistically significant differences are observed only for physical health dimension (t = -2.997, df = 141, p < 0.01) and psychological dimension (t = -2.559,p <0.05).
The results are partially concordant with other existing studies (15, 16), although there are numerous other studies that show no difference in the quality of life level between genders in schizophrenia (17, 18).
There are significant differences in mean scores of the WHO-DAS II between the female and male only for Movement dimension (t = -3.552, df = 139, p <0.001). For this dimension females recorded higher averages values of WHO-DAS II scores. For the other five WHO-DAS II dimensions, t test for independent samples revealed no statistically significant differences between men and women (p> .05).
The results obtained are in contrast with those obtained in other studies that reported levels of disability statistically significant higher for the Personal, Ocupational , Social and General domains (19).
REFERENCES
1.Iacono WG, Beiser M. Where are the women in first-episode studies of schizophrenia? Schizophrenia Bulletin 1992;18: 471–480.
2.Szymanski S, Lieberman JA, Alvir JM, et at. Gender diiThrenccs in onset of illness, treatment response. course and biological indenes in first episode schizophrenic paticnts. Amer. J. Psychiat 1995;152: 698-703.
3.Castle DJ, Abel K, Takei N, Murray RM. Gender differences in schizophrenia: Hormonal effect or subtypes? Schizophrenia Bulletin 1995;21: 1–12.
4.Test MA, Burke SS, Wallisch LS. Gender differences of young adults with schizophrenic disorders in community care. Schizophrenia Bulletin 1990;16: 331–344.
5.Lieberman J, Jody D, Geisler S, et al. Time course and biologic correlates of treatment response in first-episode schizophrenia. Archives of General Psychiatry 1993;50: 369–376.
6.Opjordsmoen S. Long-term clinical outcome of schizophrenia with special reference to gender differences. Acta Psychiatrica Scandinavica 1991;83: 307–313.
7.Bardenstein KK, McGlashan TH. Gender differences in affective, schizoaffective, and schizo- phrenic disorders: A review. Schizophrenia Research 1990;3: 159–172.
8.Ring N, Tatitam D, Motitague L, at al. Gender differences in the incidence of definite schizophrenia and atypical psychosis – Focus on negative symptoms of schizophrenia. Acta Psyehiatr.Scand 1991;84: 489-96.
9.Carpenter WT, Heinrichs DW, Wagman AMI. Deficit and nondeficit forms of schizophrenia: The concept. American Journal of Psychiatry 1988;145: 578–583.
10.Basu D. Quality of life issues in mental health care: past, present, and future. Ger J Psychiatr 2004;7(3): 35-43.
11.Awad AG, Voruganti LNP. Intervention research in psychosis: issues related to the assessment of quality of life. Schizophrenia Bull 2000;26: 557-64.
12.World Health Organization. Geneva: Division of Mental Health, WHO, 1994. Qualitative research for health Programme.
13.WHO. Geneva: WHO. International classification of Impairment Disability and Handicap, 1980.
14.Buell GJ, Sharratt S, Althoff ME. The efficacy of psychiatric rehabilitation. Psychol Bull 1972;78: 447–56.
15.Atkinson M, Zibin S, Chuang H. Characterizing quality of life among patients with chronic mental illness: A critical examination of the self- report methodology. Am J Psychiatry 1997;154: 99–105.
16.Koivumaa-Honkanen HT, Viinamäki H, Honkanen R, et al. Correlates of life satisfaction among psychiatric patients. Acta Psychiatr Scand 1996;94: 372–8.
17.Heider D, Angermeyer MC, Winkler I, et al. A prospective study of Quality of life in schizophrenia in three European countries. Schizophr Res 2007;93: 194–202.
18.Kearns RA, Taylor SM, Dear M. Coping and satisfaction among the chronically mentally disabled. Can J Commun Ment Health 1991;6: 13–25.
19.Shankar R, Kamath S, Joseph AA. Gender differences in disability: A comparison of married patients with schizophrenia. Schizophr Res 1995;16: 17–23.
***